The Structure and Properties of Aluminium Alloys
Explore the structure and properties of aluminium alloys in this comprehensive book. Learn about their composition, thermal, mechanical, and electrical properties.
Aluminum Alloys: Structure and Properties
The book by L. F. Mondolfo
CONTENTS
1 – Pure and Commercial Aluminum
- Composition
- Structure
- Thermal Properties
- Mechanical Properties
- Electrical, Magnetic Properties
- Radiation
- Chemical Properties
2 – Binary Alloys
3 – Ternary, Quaternary, etc., Alloys
4 – Commercial Alloys
- Aluminum-Copper Alloys
- Aluminum-Silicon, Aluminum-Magnesium Silicide Alloys
- Aluminum-Magnesium, Aluminum-Manganese Alloys
- Miscellaneous Alloys
Appendixes
- Metric Units and their Conversion to Other Units
- Temperature Conversion
- Conversion from Atomic to Weight Per Cent
- Abbreviations Used in the References
- Additional References

Some of the most interesting data from this book about aluminum alloys structure and properties
Table 1.4 – Approximate percentage change in density
per addition of 0,10% by weight of the element
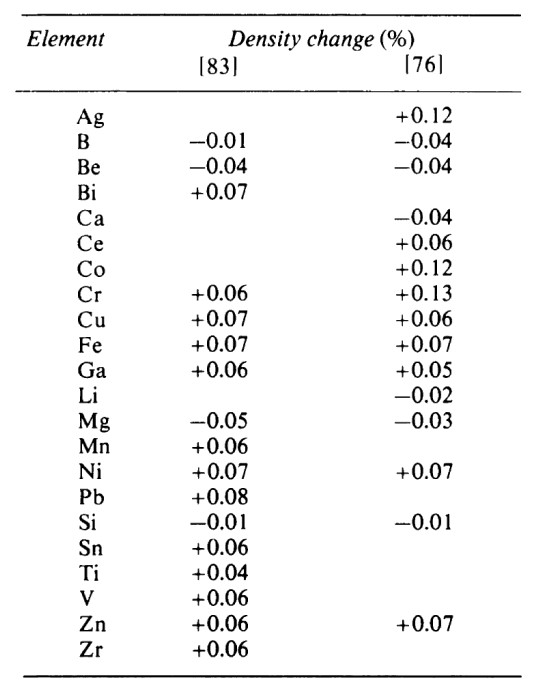
Notes:
1) The effect of most elements on density can be calculated from element’s densities. In Table 1.4 are shown the changes produced by 0,1% additions. The change also depends on whether the addition is in solution or present as a separate phase, but for most commercial alloys this factor is minor. The calculations for dilute alloys from the above coefficient differ by less from experimental.
2) The density of commercial aluminum depends mainly on the iron and silicon content. Iron increases density and silicon decreased it, but much less. Thus, especially with Fe/Si ratios of the order of 2700-2710 kg/m3, which is few per cent higher than for pure aluminum.
Table 1.12 – Hardness Conversion
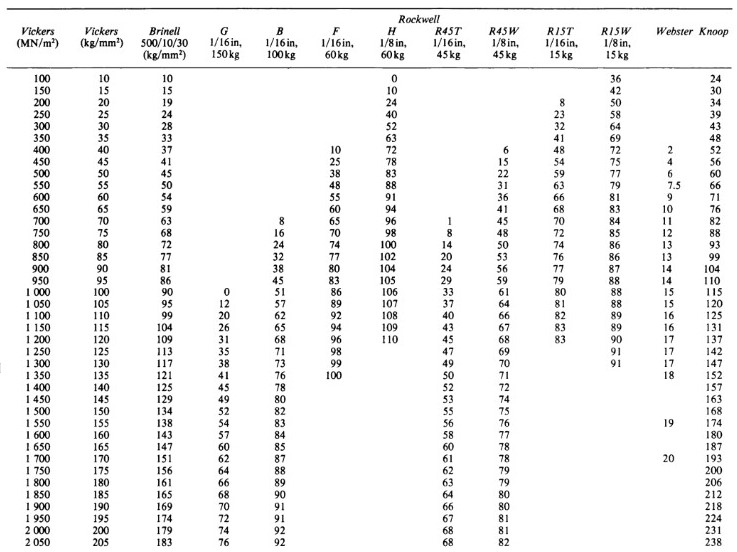
Notes:
1) Vickers numbers are given in MN/m2 and in the original kg/mm2 2) Brinell numbers can also be expressed in MN/m2 3) The correct conversion factor from kg/mm2 to MN/m2 is 9,80665. A factor 10 has been used in the table because fractional hardness numbers imply an accuracy that is hardly justified. The rounded values carry an error of less than 2%, in a measurement that is seldom accurate ± 5%. 4) It must also be remembered that the correspondence between the various methods and scales is far from exact and constant for all alloys
Table 1.13 – Mechanical properties of Aluminum
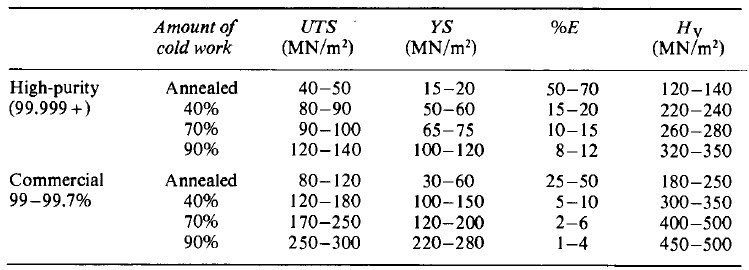
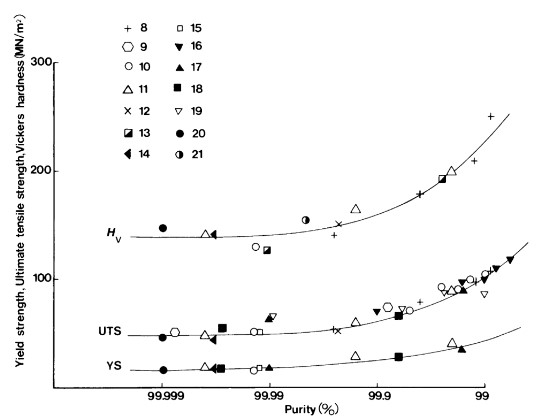
Figure 1.14 – Hardness and strength of aluminum as function of purity, according to various authors
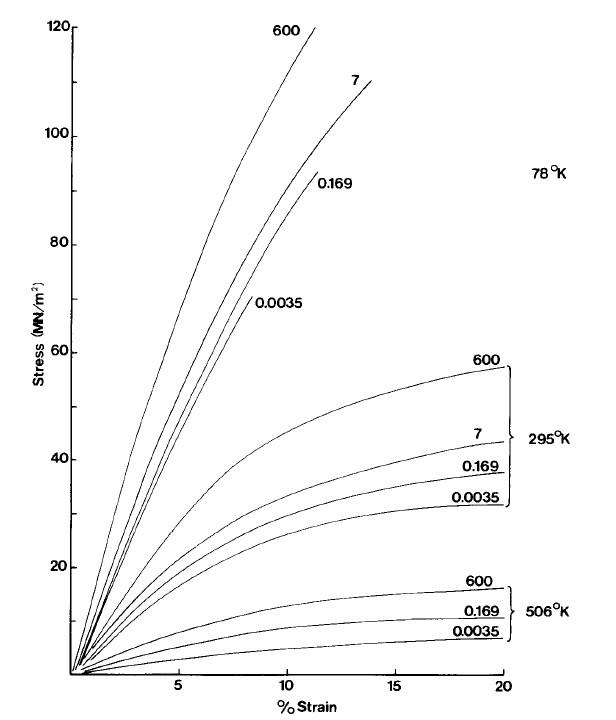 Figure 1.15 – Stress-strain curves of pure aluminum as function of strain rate (ε/hr) and temperature
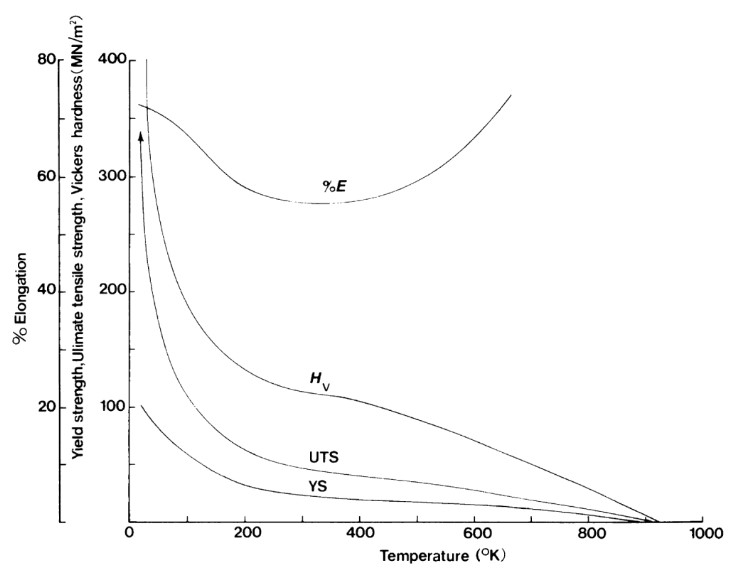
Figure 1.18 – Change in mechanical properties of pure aluminum
as function of temperature.
%E = percentage elongation; HV = Vickers hardness;
UTS = ultimate tensile strength; YS = yield strength
 Figure 1.20 – Variation of modulus of elasticity and shear modulus of aluminum as function of temperature, according to various authors
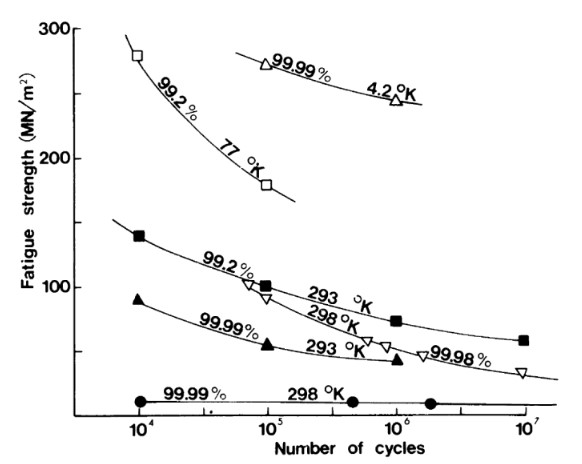 Figure 1.21 – Fatigue of aluminium as function of purity and temperature, according to various authors
